Reports & Infographics
I transform raw data and complex information into clear, visual reports and presentations that support decision-making, storytelling, and student learning. From outcome reports used by leadership, to survey dashboards, to instructional workshops, these projects demonstrate my ability to balance detail with design.
Report Design & Data Visualization
Adobe InDesign & Excel

Developed the Career Development Center’s annual outcomes report, transforming raw employment and internship data into a polished publication. Designed with institutional branding, infographics, and clear narrative flow, the report became a reference tool for leadership, faculty, and external stakeholders.
Canva & Excel
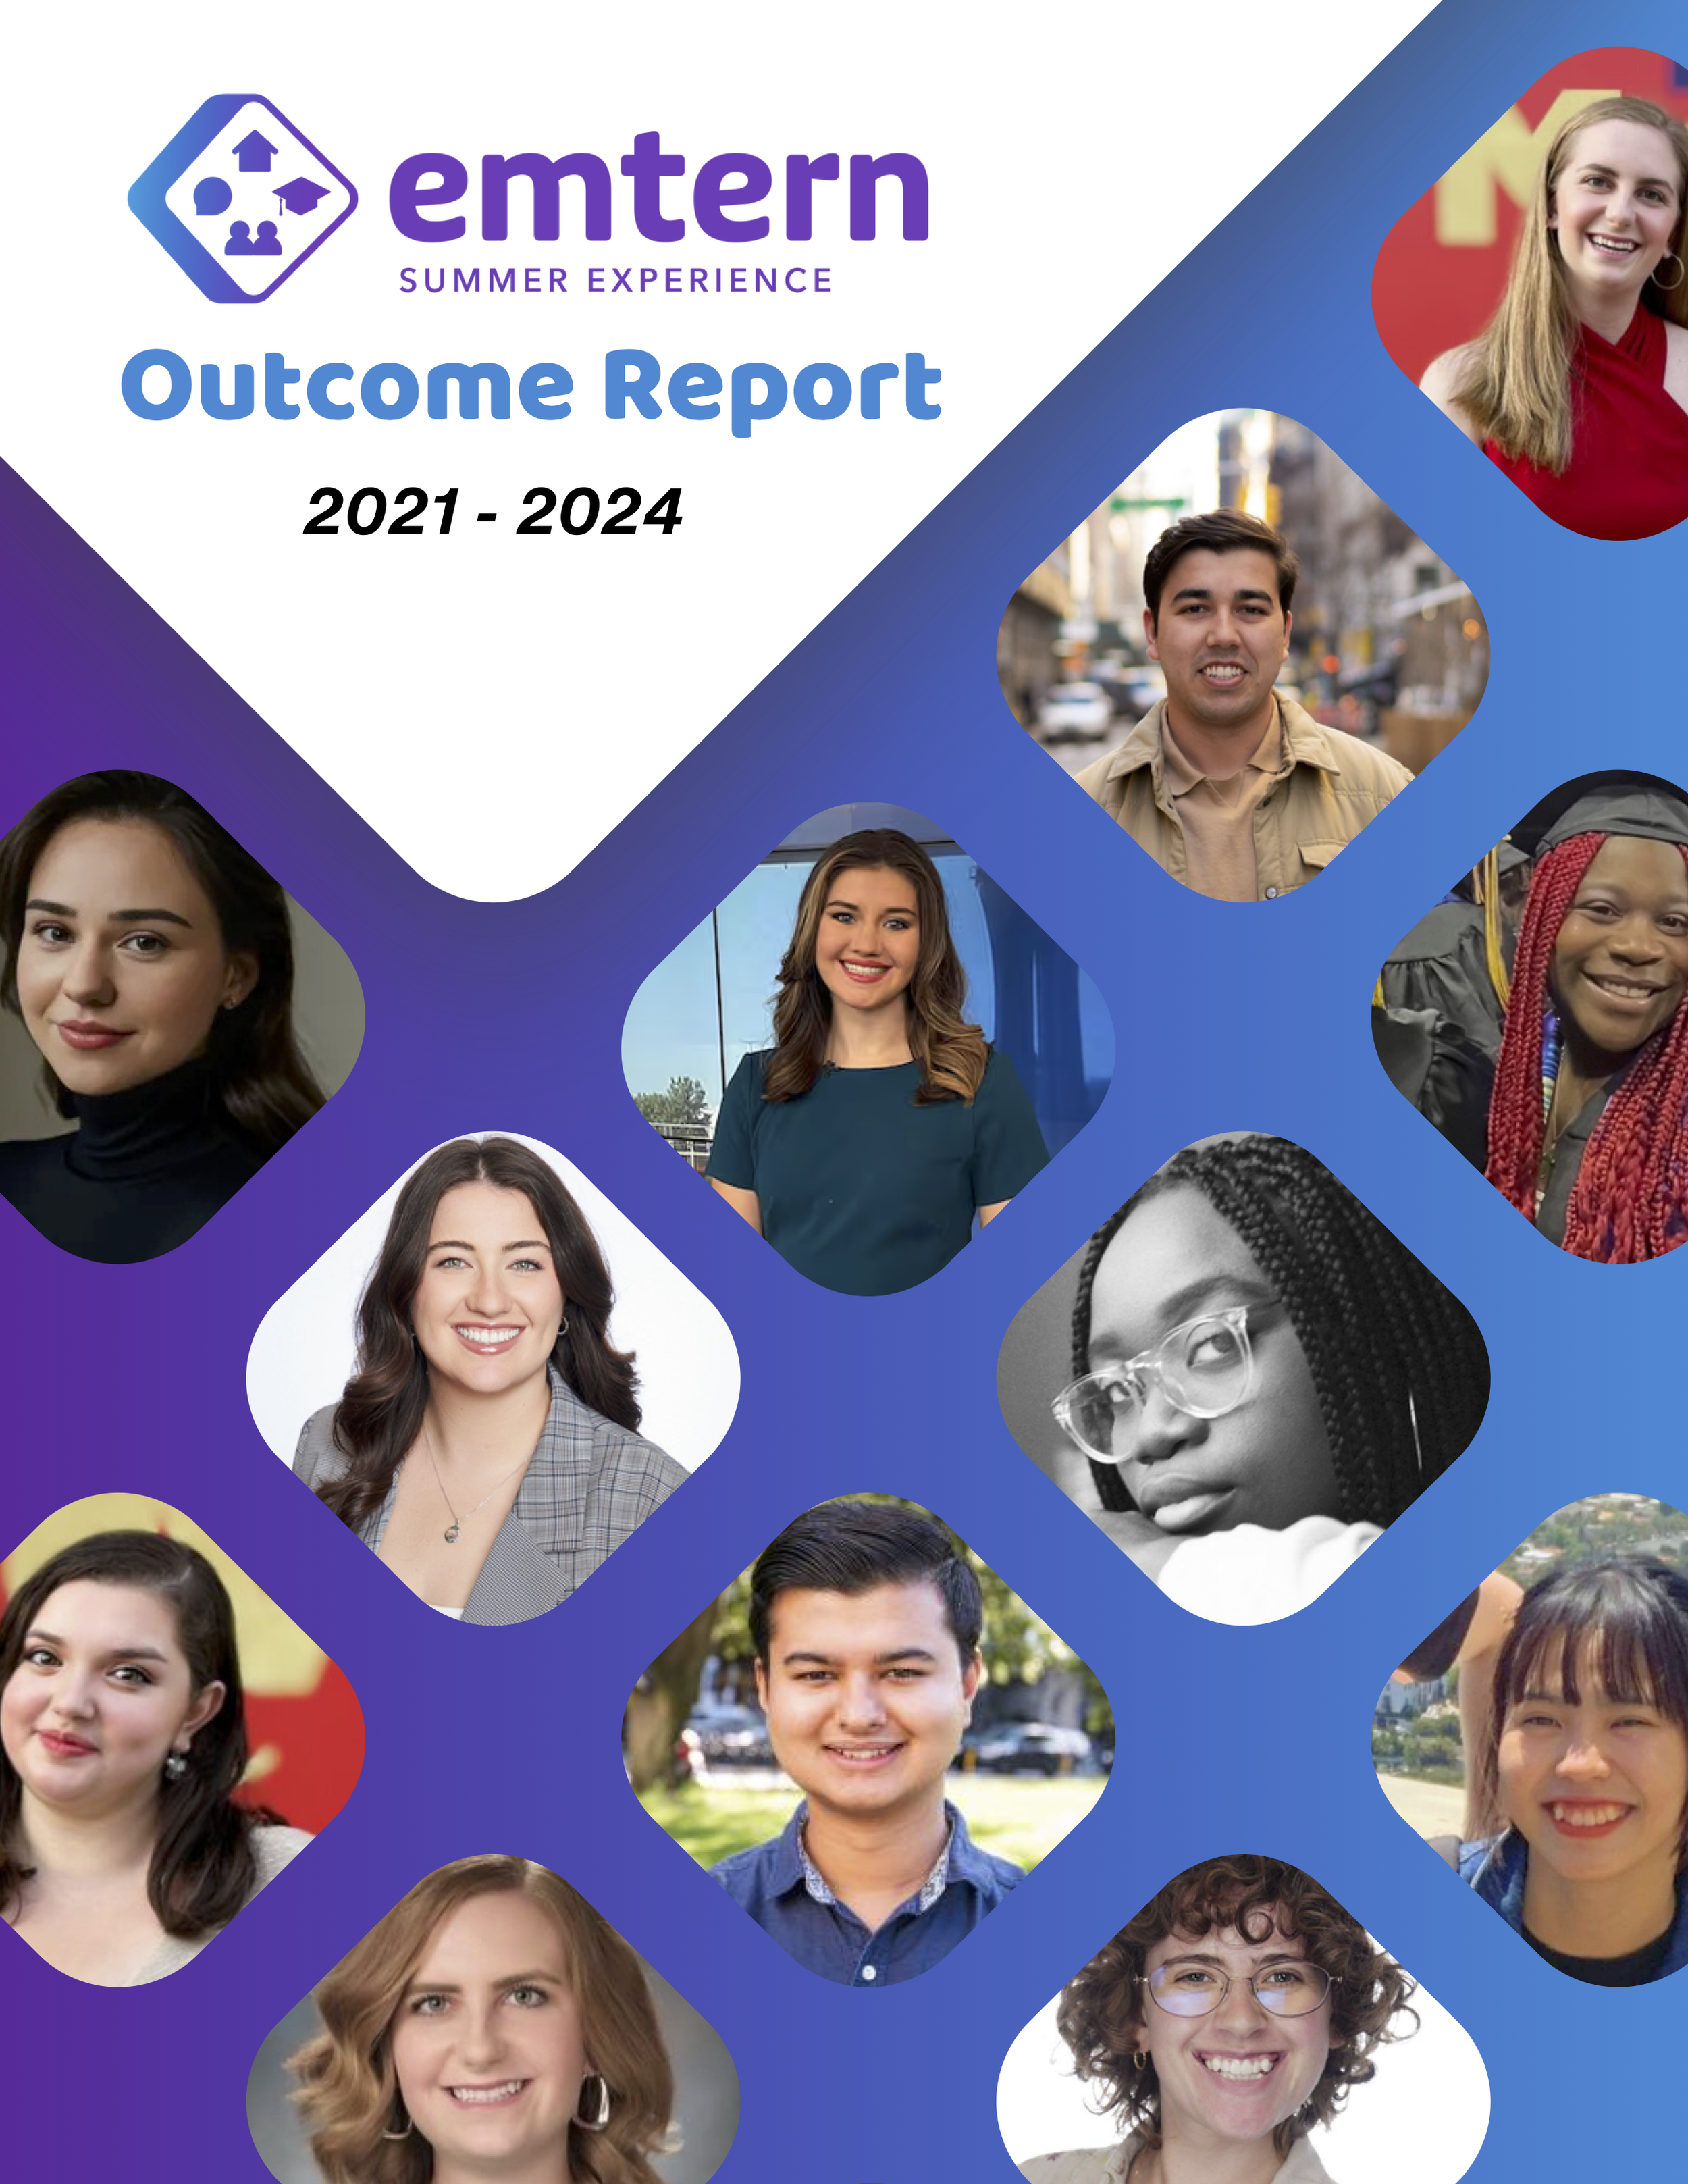
Produced a multi-year outcomes report for a competitive internship and mentorship initiative. Transformed complex datasets into straightforward infographics, emphasizing trends in employment sectors, geographic placements, and initial career destinations. Created an easily understandable document for institutional leaders, alumni donors, and external parties.
Survey & Proposals
Student Survey Presentation
Survey Analysis & Data Visualization | Canva
Designed a presentation translating raw survey data into clear, actionable insights for stakeholders. The deck highlighted trends in student career readiness, barriers to engagement, and areas for program growth.
Impact: Equipped leadership and staff with digestible findings that informed programming decisions and helped prioritize resources for student support.
Strategic Proposal & Visual Design | Canva
Created a campaign proposal designed to boost participation in the First Destination Survey. Combined data insights with creative campaign concepts, outlining messaging, graphics, and rollout strategy in a branded, easy-to-digest format.
Impact: Demonstrated how data-informed storytelling could drive student action and awareness about the FDS, to increase submission to this optional survey.
Instructional Design & Presentation | Canva
Developed and delivered a Skill Session workshop guiding students through optimizing their LinkedIn profiles for professional visibility. To keep the session engaging, I blended clear step-by-step instruction with cultural references (from Legally Blonde to Pokémon) that resonated with a Gen Z audience.
Impact: The workshop increased student confidence in building their online presence and received positive feedback for its approachable tone. This event got ~40 registrations!
